
Studio | Configure
Data Studio: Investment Data Modelling
Structure and transform your investment data to deliver cleaner insights, custom attribution, and faster bespoke reporting.
Middle office · Portfolio managers & performance analysts
Studio | Configure. Run the analytics — performance, attribution, factors — and explore it through interactive charts and drill-downs. Build the report from a template, then push it into a portal or pull it through the API. The numbers stay live at every step.
Analytics Engine
We calculate it, not just format it. Performance, attribution, factors and risk — calculated directly from the book, then explored through interactive charts and drill-downs, not static exports.
- Performance CalculationsCalculate returns from the book itself, 1M to inception or any custom period.
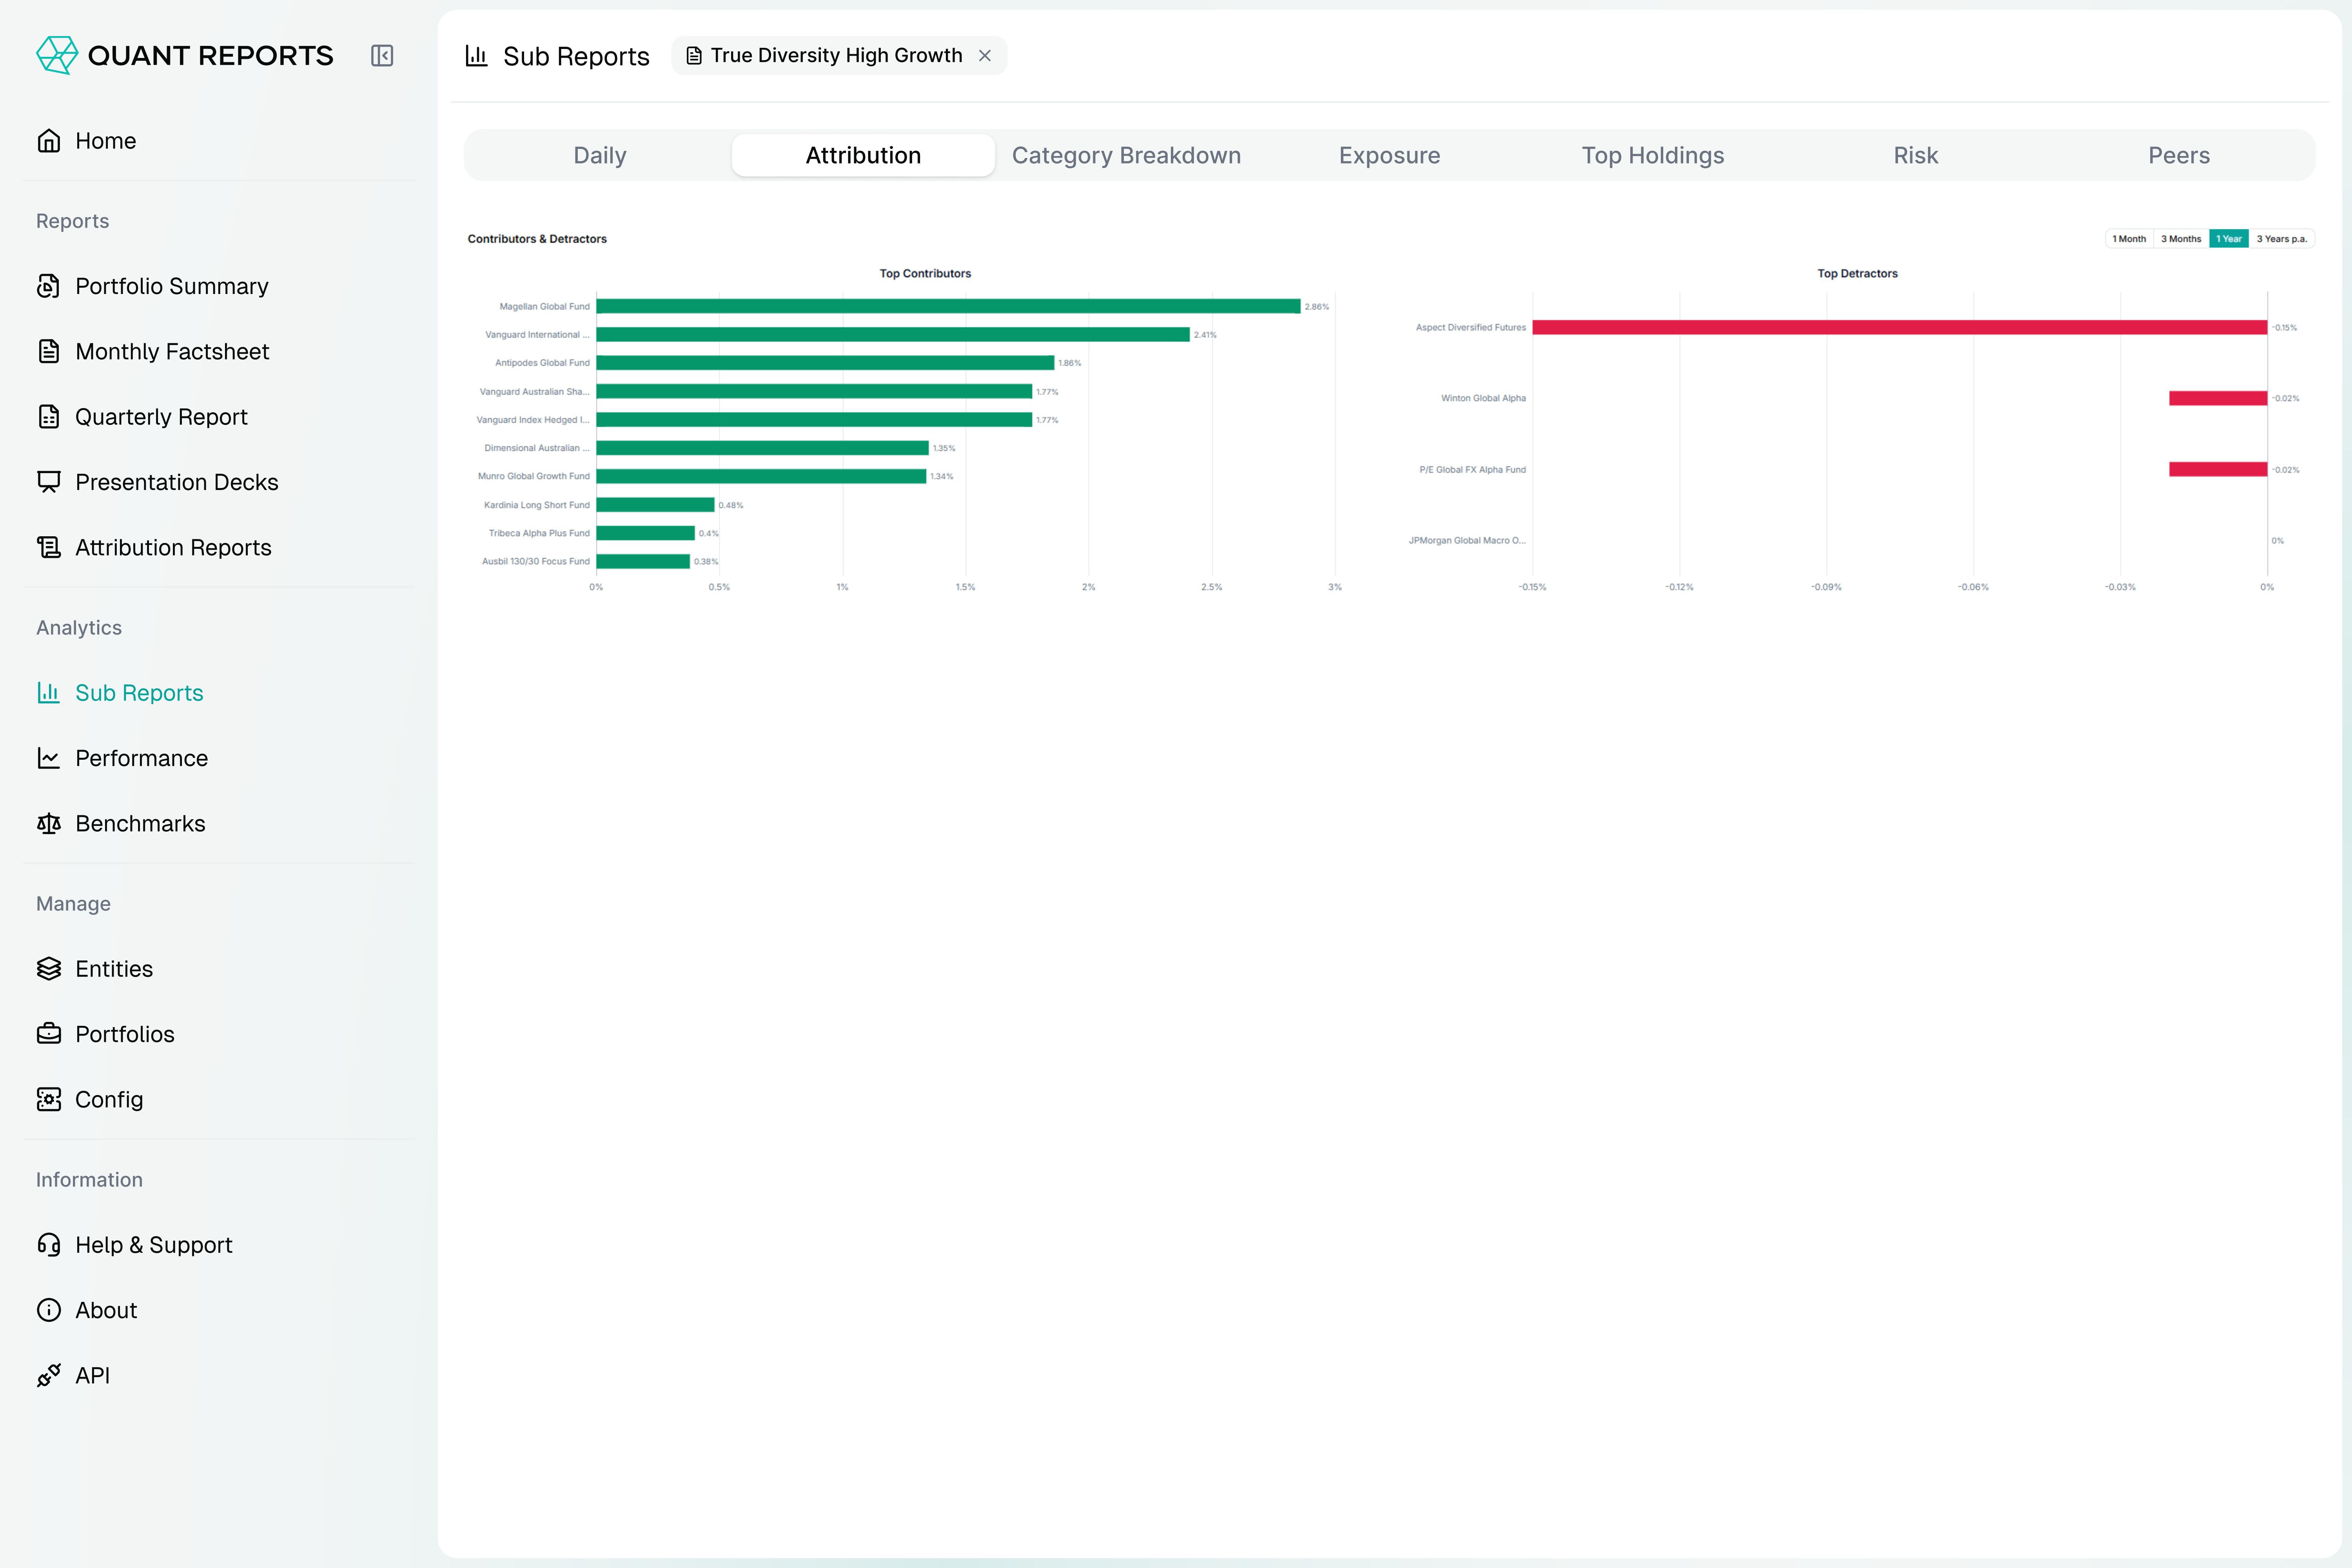
- Portfolio AttributionBreak down performance by what actually drove it — sector, security, factor.
- Interactive Time SeriesFull historical series, not just point-in-time snapshots, ready to chart.
- Risk AnalyticsVolatility, drawdown and exposure metrics computed alongside performance.
- Peer ComparisonBenchmark your numbers against peers or public indices, side by side.
Report Builder
Build it once, reuse it everywhere. Templated reports built on live, computed data — toggle components on and off, no re-keying. Build a report once, then reuse it as a block inside any other report.
- Template EditorBuild custom templates from scratch, for advanced users or built for you.
- Components & WidgetsDrop in pre-built charts, tables and metrics as blocks.
- Report LibraryStart from existing report layouts instead of a blank page.
- Dynamic FieldsCommentary, disclaimers and text that auto-populate from live data.
- Embedded VisualsCompact, report-ready charts — interactive, but sized for a factsheet.
Integration Library
Live where your clients already look. Push live, computed widgets into portals and sites, or pull the data through the API — the numbers stay connected.
- Live ReportsEmbed a full report into a portal or site, always showing current data.
- Interactive WidgetsDrop individual charts or metrics into any page, live-linked to source.
- PortalsPublish directly into client or internal portals, no manual export.
- REST APIPull any widget, report or dataset programmatically into your own systems.
Before Quant Reports
- Interactive Analytics
Static PDFs, scattered metrics
Live dashboards with drill-downs and embeddable views
- Expert Assistance
No dedicated reporting partner
DIY or partner support in a secure, role-based workspace
- Streamlined Workflows
Version drift, endless re-formatting
Smart templates + pipelines; update once, sync everywhere
- AI & Automation
Manual prep, hand-typed notes
Automated ingestion, AI-assisted QA and commentary
- Data Transformation
Siloed systems, messy imports
Custom transforms, full compliance, flexible exports
Unify analytics, attribution, and structure in one layer
Use dashboards, pipelines, and custom logic to manage portfolios by asset class, strategy, risk, or peer group.
Reporting library
Shadow portfolios, x-ray holdings, peer indexes, peer comparisons, risk analysis, relational data model, tactical attribution, custom benchmarks, investment monitoring and factor analysis.
See the reporting libraryPlatform architecture
Case study
Cooper Investors Pty Ltd
Cooper Investors—a 20-year-old Australian fund manager of ten specialist equity funds—now uses a reporting framework that automates reporting (Factsheets & Quarterly Reports) and live website metrics, producing on-brand reports seamlessly.
Read the full case study
- Integrated Website Widgets
- Fund and Portfolio Reporting
One integrated platform across three layers — data, analytics, publishing
Connect data once and let it flow end-to-end. One change updates everywhere.