
Fund factsheets
Your fund factsheets, delivered faster, smarter, and on-brand
Whether you manage 5 funds or 500, Quant Reports helps you scale effortlessly — save time, reduce errors, and deliver polished, professional factsheets in minutes.
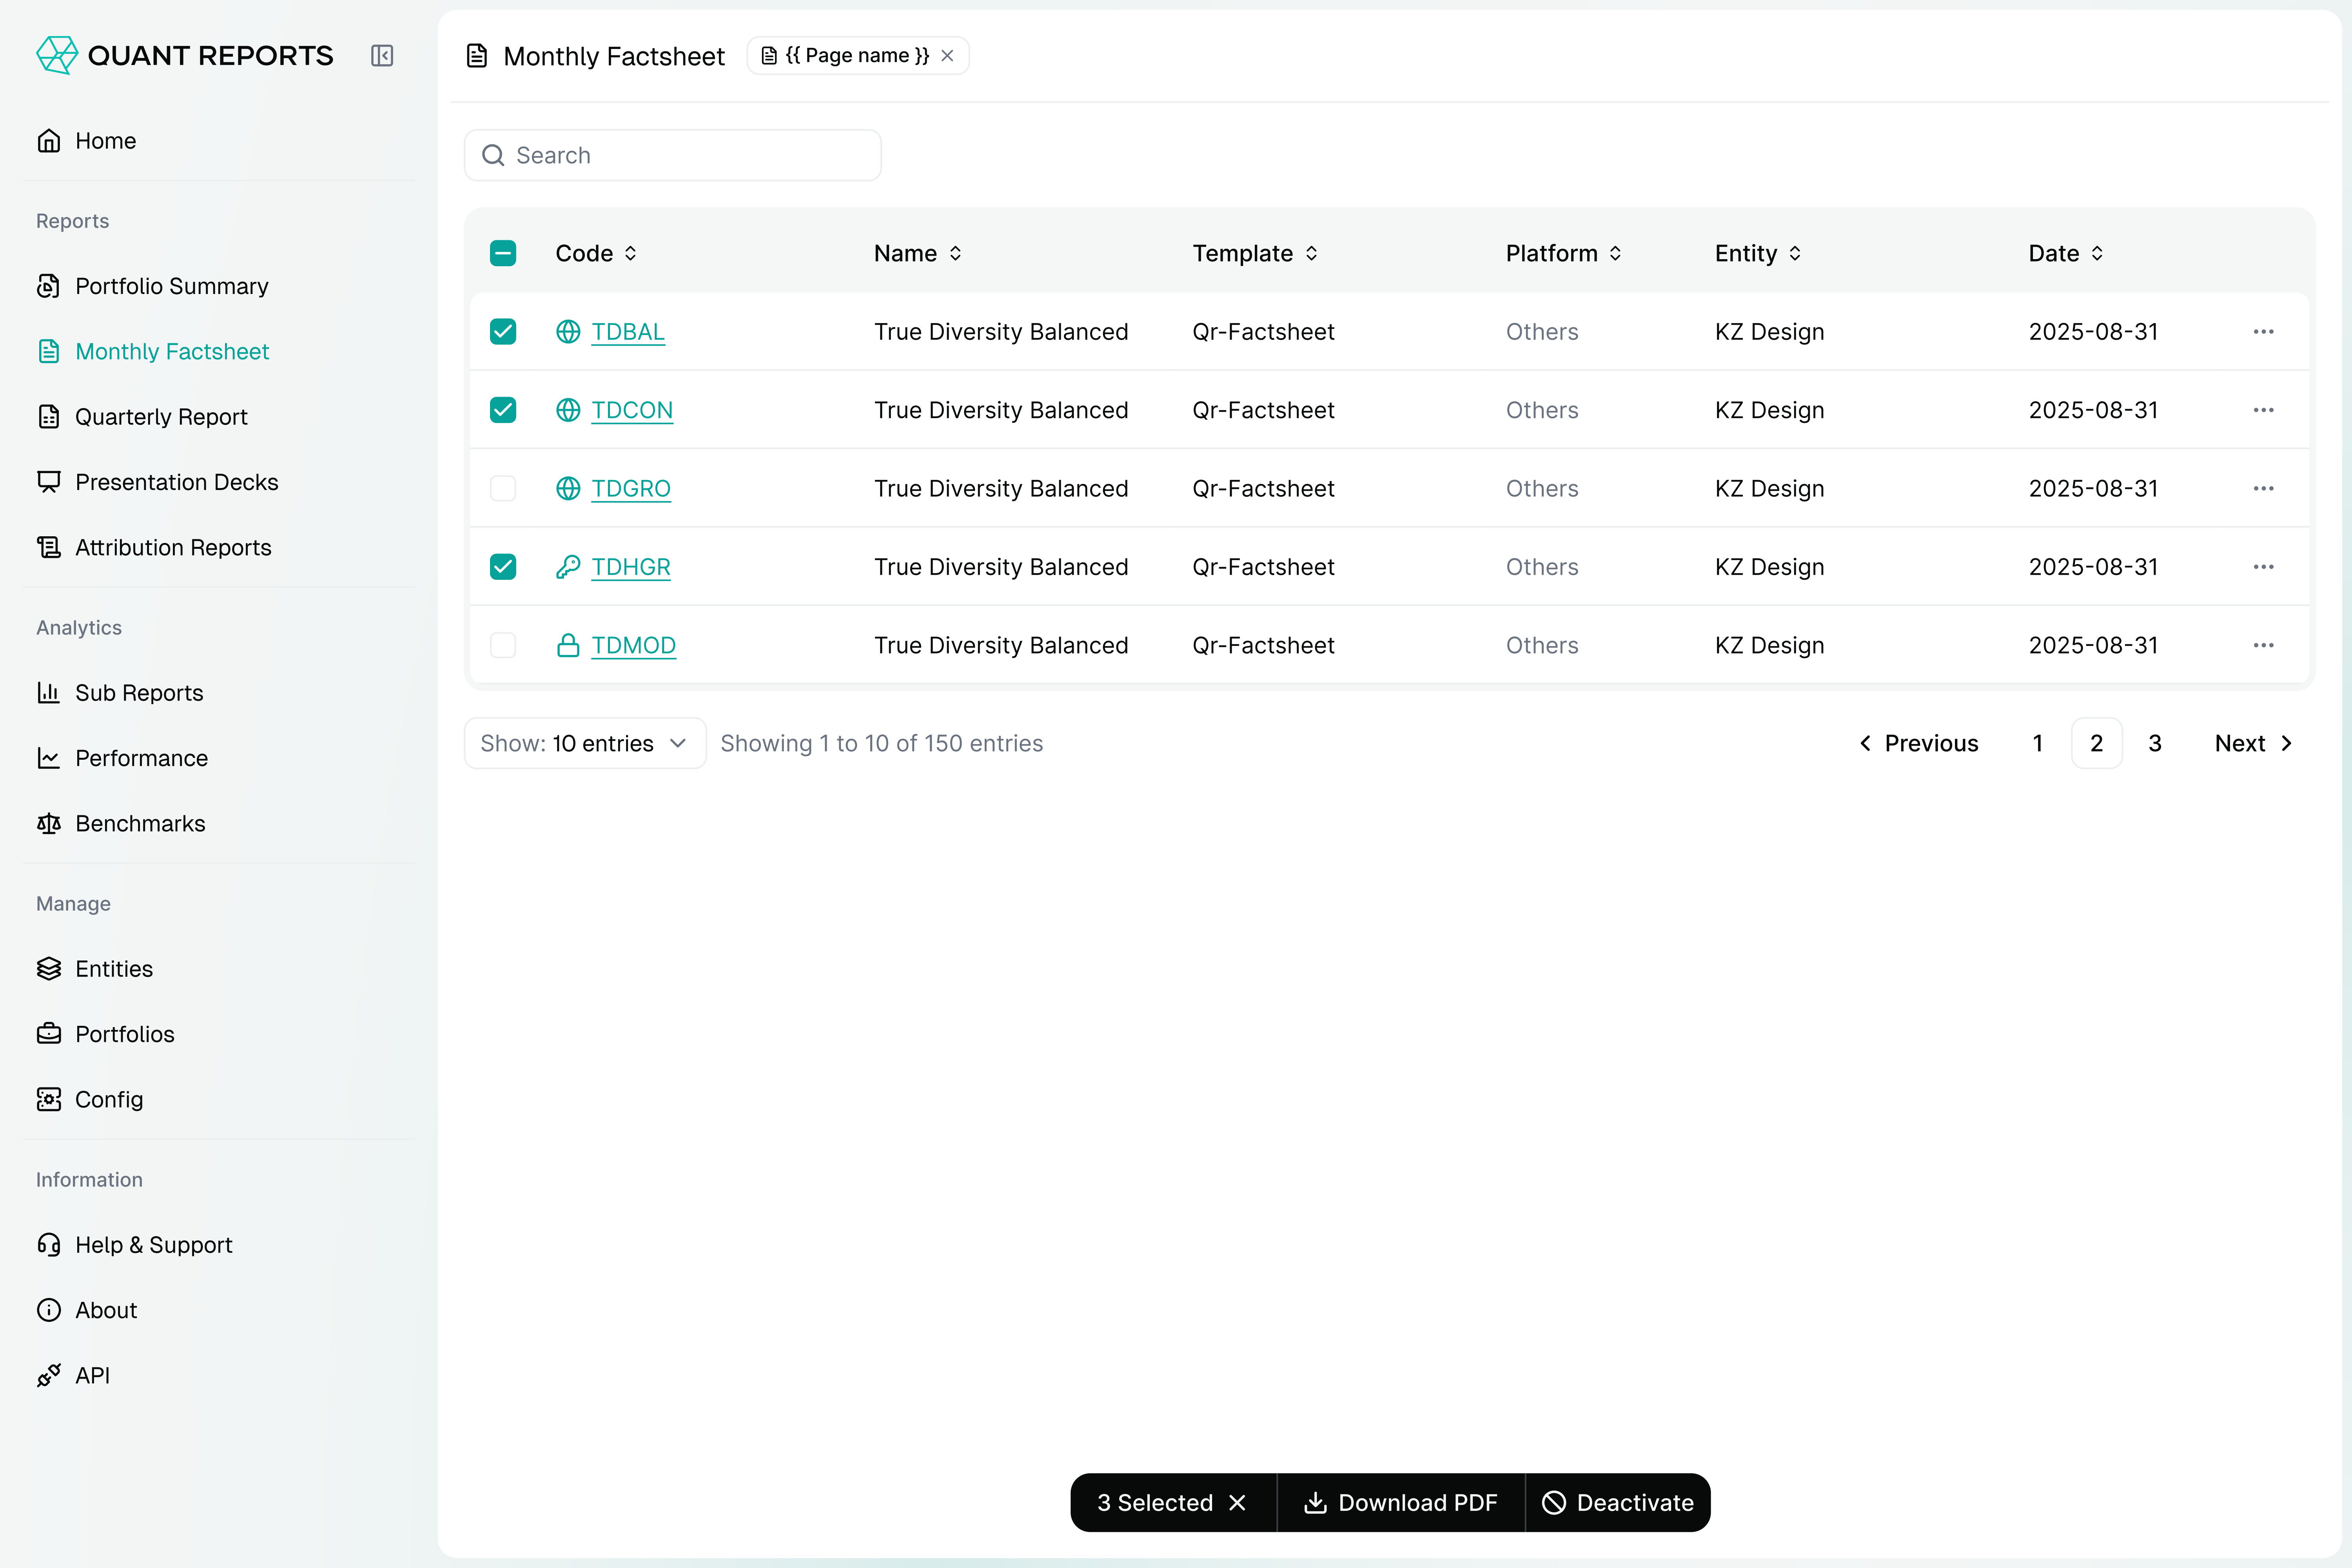
Factsheet production is where most reporting teams lose their month Factsheet production is where most reporting teams lose their month. Data arrives from custodians and administrators in different shapes, someone rebuilds the same layout by hand, and every correction has to be made twice. Quant Reports takes the data once, applies your template and disclosures, and produces every factsheet in the set — 5 funds or 500 — in a single run. More than 10,000 reports and over $100 billion in reporting assets have been produced this way.
- $100 billion+in reporting assetsIllustrative
- 10,000+reports producedIllustrative
Powerful factsheets without the formatting struggle
Automate performance data, simplify compliance, and delight investors with branded, audit-ready factsheets — without the manual grind.
Automation
Generate factsheets in minutes, not days. Eliminate repetitive tasks and free your team to focus on what matters.
Accuracy
Stay fully compliant and error-free with automated data syncing, validation checks, and real-time updates.
Flexibility & customisation
Design factsheets your way. Easily tailor layouts, branding, and data points to suit your unique mandates.
Scalability
Handle any volume with ease. Whether you're managing 5 funds or 500, Quant Reports easily adapts to your demands and structure.
Quant Reports transforms fund reporting into a seamless, investor-ready experience
In finance, things move fast. Quant Reports ensures you never fall behind by making it easy to connect data sources, customise reporting, and scale with confidence.
Branded to perfection
Every report looks in-house. Your layouts, your colours, your logo — perfectly applied across every factsheet, every time.
Professional design that builds trust
Dynamic charts, crystal-clear performance visuals, and consistent formatting boost credibility and engagement from the outset.
Interactive & digital-first
Move beyond static PDFs with interactive options, embedded charts, and web-ready outputs that engage investors directly.
Portfolio analytics
Get a complete view across funds, models, and asset classes. Quant Reports helps you monitor exposure, attribution, and performance from one intuitive platform.
Portfolio analyticsWhite-label branding
Build branded, compliant reports powered by your unified data. Strengthen your identity across every output with automated design consistency and control.
White-label brandingHow are people using Quant Reports today?
I liked the fluidity and simplicity of Quant Reports fact sheets
The implementation of Quant Report’s solution also broadened the scope of our fact sheet production
Case study
Cooper Investors Pty Ltd
Cooper Investors uses a reporting framework that automates data ingestion and reporting (Factsheets & Quarterly Reports), producing on-brand reports seamlessly.
Read the full case study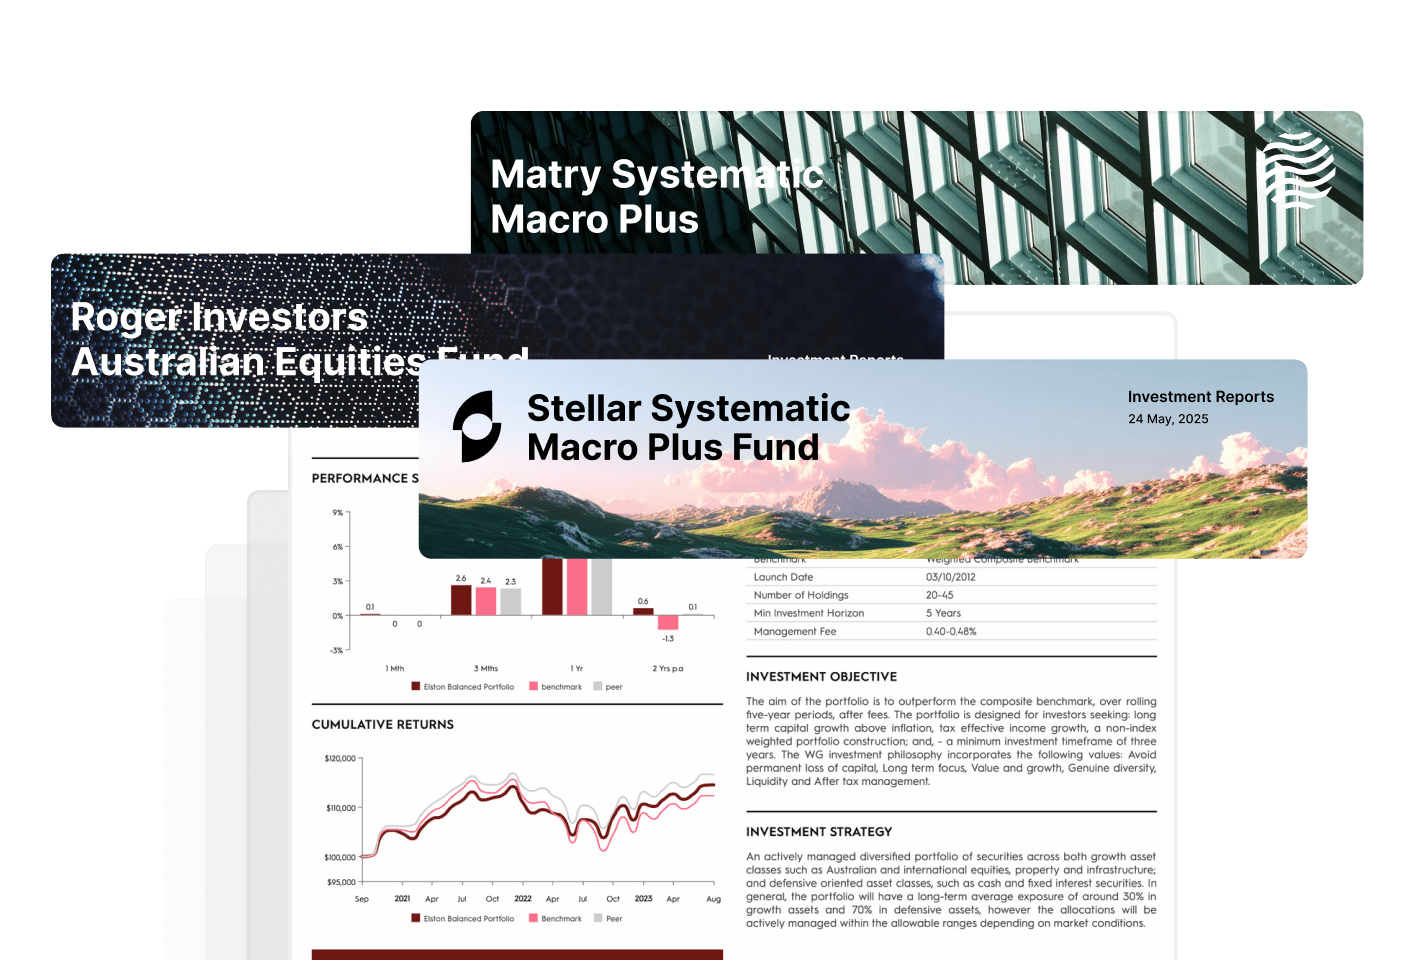
Under the hood
Built from these parts of the platform
A monthly factsheet is a template, a brand and a delivery date. Three modules cover all three.
Related reading
All insights- Automate Your Fund Factsheet Production – Tailor Fact Sheets That Wow Investors
Automate and streamline your fund factsheet production, slash manual errors and impress investors with data-rich, compliant reports.
- Fund Factsheet Reporting
If you manage a fund, then you know how important it is to have accurate and up-to-date reporting. Factsheet reporting, fund reporting, and fund management reporting are all critical components of running a successful fund.
- GIPS Compliance for Fund Factsheets
The Quant Reports platform has all the required widgets and calculation methodologies to present GIPS compliant presentations.
- The Digital Fund Factsheet Revolution
Digital fund factsheets offer significant advantages, at Quant Reports we consider them to be an evolution in fund marketing.
Configure once, reuse everywhere
Build a reusable analytics layer: structure and transform portfolio data, run custom attribution and peer comparisons, then publish live charts straight to Report Studio.