
Portfolio analytics
Quant Reports powers your performance and analytics reporting
Track, analyse, and visualise investment performance with brand-consistent, white-label analytics tools that make complex reporting effortless.
Enhanced quantitative and multi-asset analytics
In a market flooded with data, clarity is what sets you apart. Quant Reports helps fund managers cut through the noise with deep analytics, clear attribution, and visual reporting that drives smarter decisions.
Cutting-edge performance analysis
Powerful digital charts track investment performance and highlight trends in real time.
See the reporting libraryRobust risk analysis
Analyse exposure and volatility across funds, models, and asset classes to identify opportunities and manage downside risk.
See the reporting libraryData-driven decision making
Empower managers with actionable insights backed by robust data, not just intuition.
Tactical portfolio insights
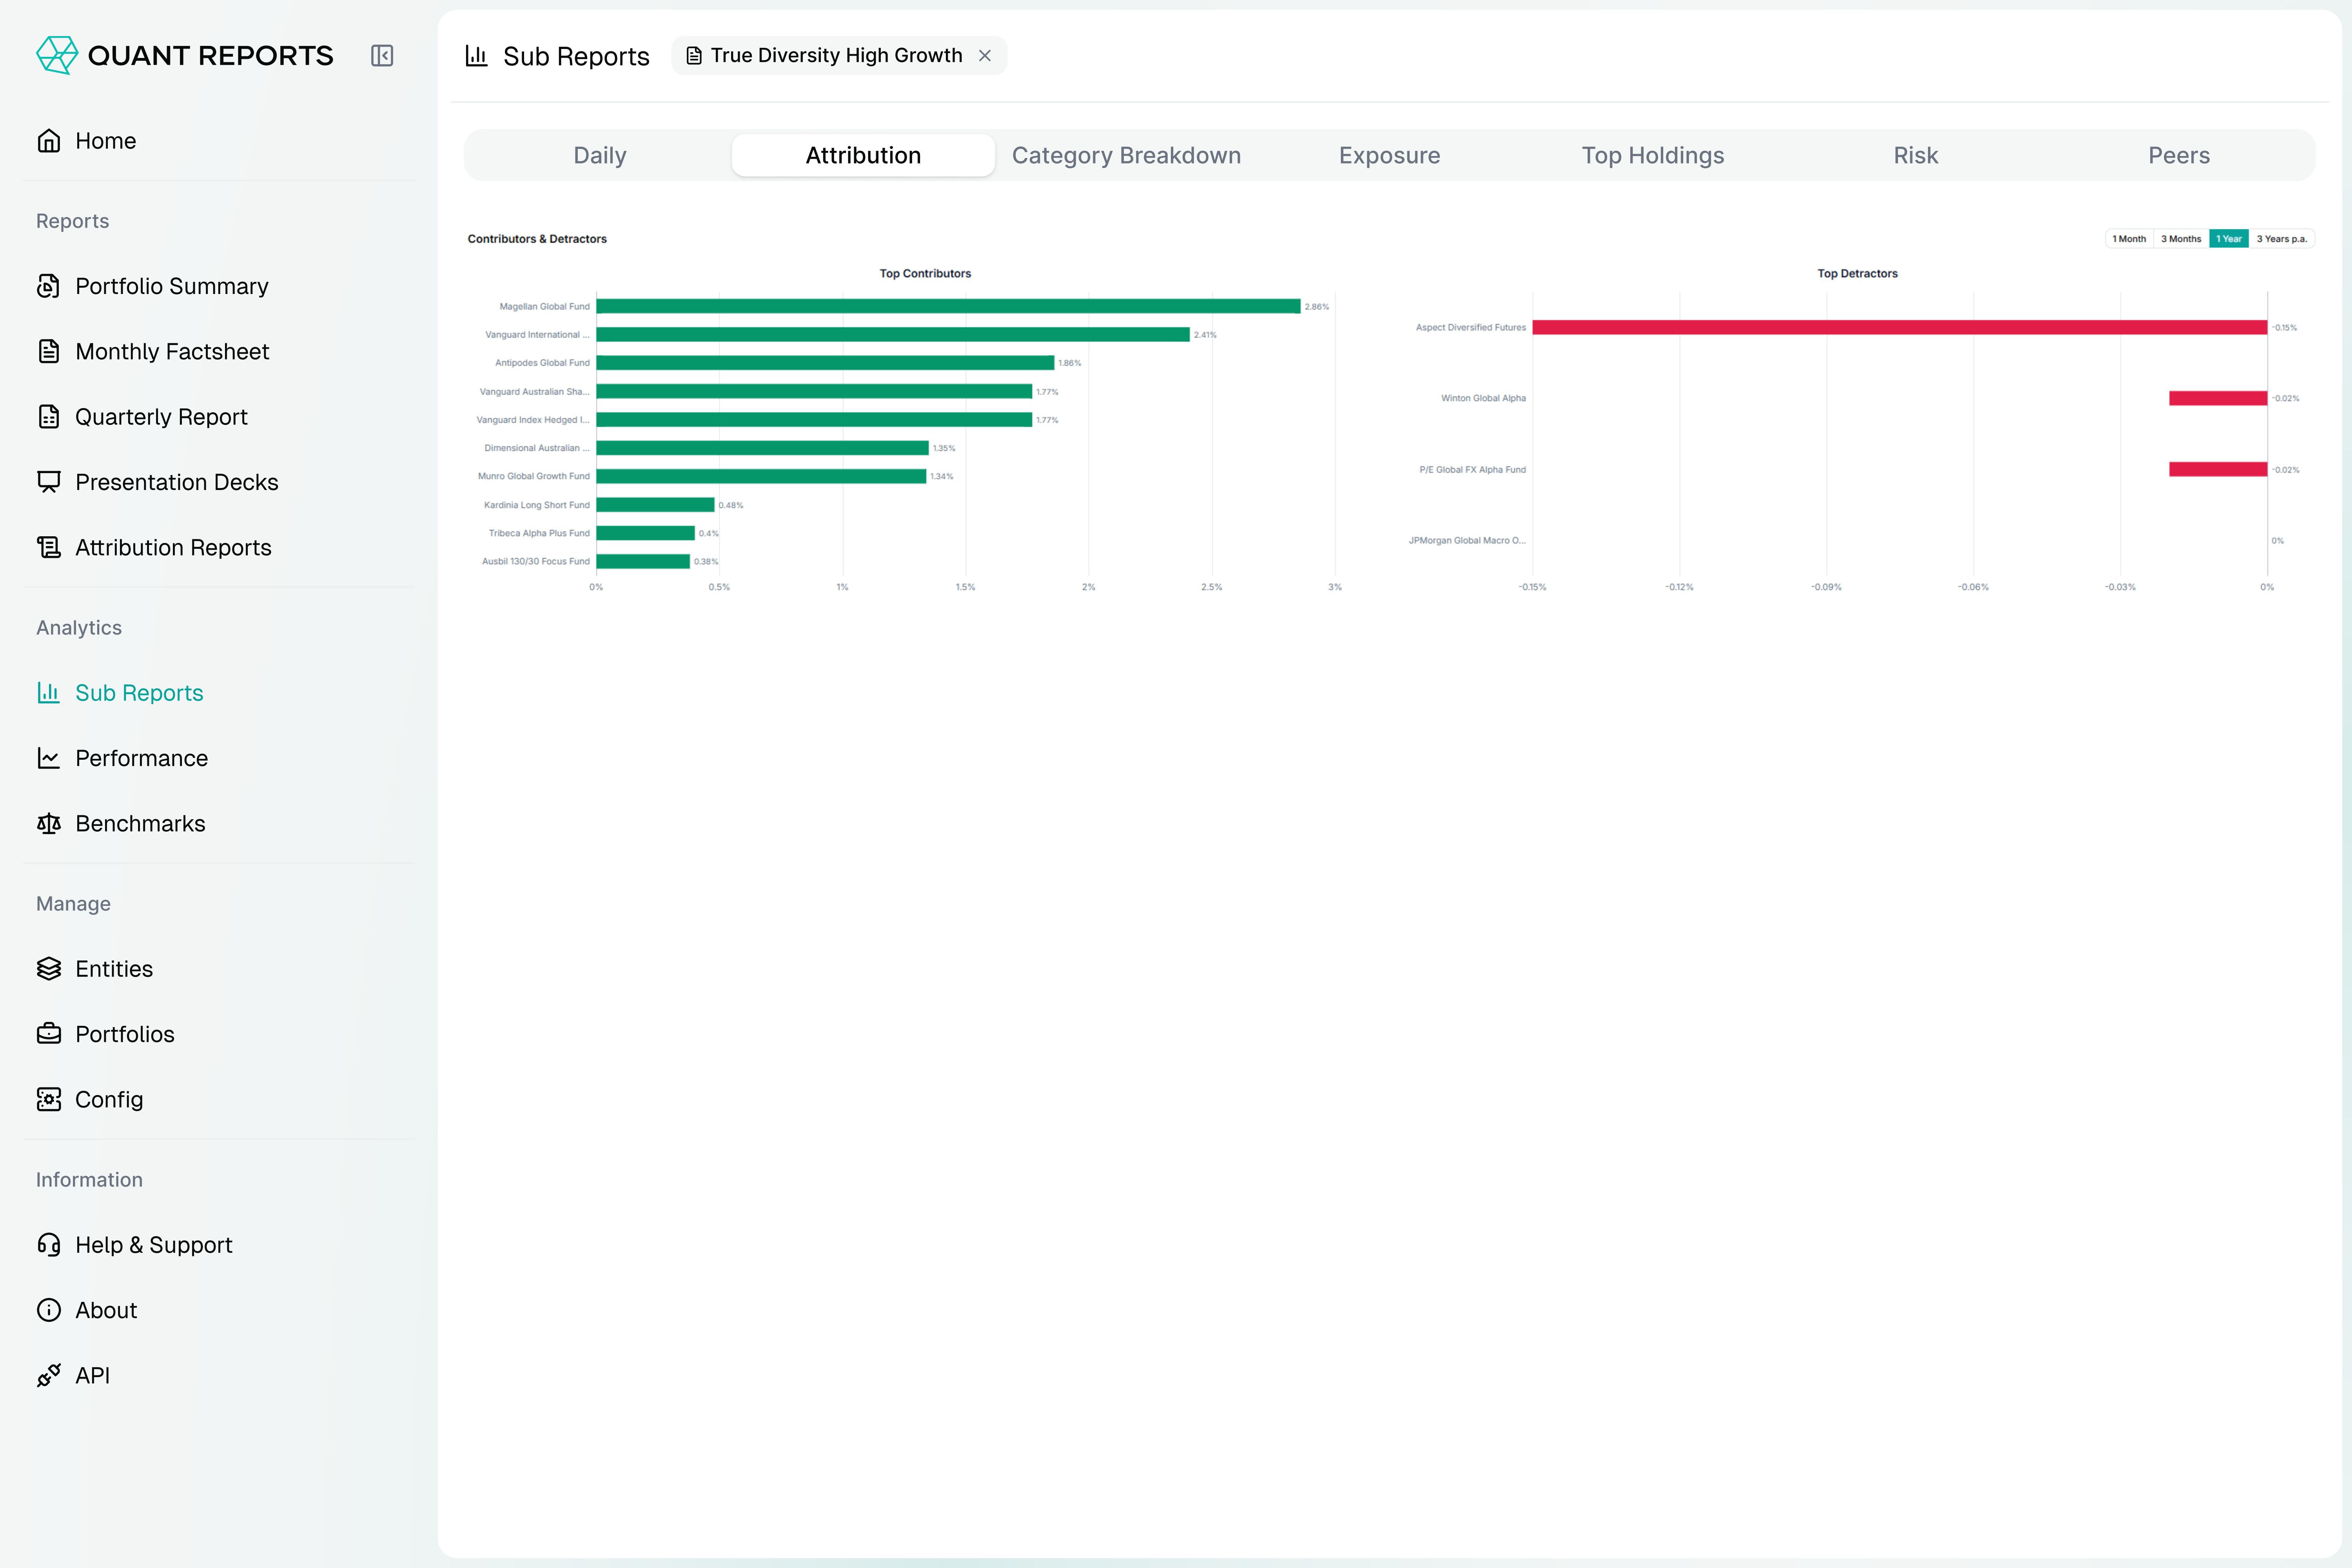
See exactly where alpha is generated — from allocation, selection, and benchmarks.
X-ray holdings
Visualise portfolio diversity with an X-ray view into sector, factor, and geographic exposures.
See the reporting libraryFull attribution
Analyse performance at every level: total plan, manager portfolio, and composite across all asset classes.
See the reporting libraryMulti-asset risk
Measure exposure and volatility at the manager or asset class level with clear, comparative risk breakdowns.
Tactical attributions
Understand drivers of alpha through allocation, selection, benchmark interaction, and advanced attribution models.
Investment monitoring
Identify correlations, competing assets, or emerging structural shifts before they impact performance.
Advanced analytics tools for deeper insight
Quant Reports provides you with a full suite of analytics to refine strategy, measure risk, and visualise performance in real time.
Investment committees
Deliver clear, data-backed analytics to committee members instantly after calculations are complete.
Live & interactive
Access a dynamic library of analytics to support research, due diligence, and investor reporting in real time.
Live trade attribution
See the reporting libraryMulti-asset tactical attribution
See the reporting libraryStrategy back testing
See the reporting libraryPortfolio construction
See the reporting libraryInteractive dashboards
See the reporting libraryRisk contributions
See the reporting libraryFund factsheets
Create polished, compliant, and fully branded factsheets in minutes. Automate performance data and deliver investor-ready reports with ease.
Fund factsheetsModel portfolios
Simplify SMA, MDA, and IMA reporting with tailored, scalable, white-label outputs. Maintain total accuracy and consistency across every platform.
Model portfoliosUnder the hood
Built from these parts of the platform
Numbers a committee will question have to be calculated from the book, not typed into a slide.
Related reading
All insights- Performance & Attribution Analysis
One of the key features of the Quant Reports platform is Attribution Analysis. It is a sophisticated tool that can be used give insights into performance of a portfolio or fund manager, and enable better decision making.
- Increase Fund Performance with Attribution & Reporting
Clients are demanding greater transparency into portfolios, therefore the investment professional needs new methods of better explaining fund performance and strategies.
Quant Reports connects every insight through your very own data warehouse
Centralise your fund and portfolio data, automate validation, and power your analytics and reports from a single, reliable source of truth.